euphonic-dispersion
The euphonic-dispersion program can be used to plot dispersion
either along a specific trajectory from precalculated phonon frequencies,
or along a recommended reciprocal space path from force constants. For
example, to plot from a Euphonic .json file containing
QpointPhononModes, with frequencies reordered to follow equivalent modes
across Q, and the y-axis minimum energy set to 0 meV, run:
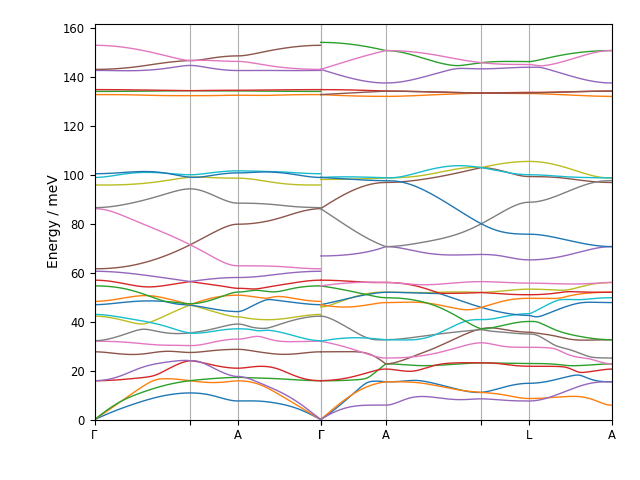
euphonic-dispersion quartz_qpoint_phonon_modes.json --reorder --e-min 0
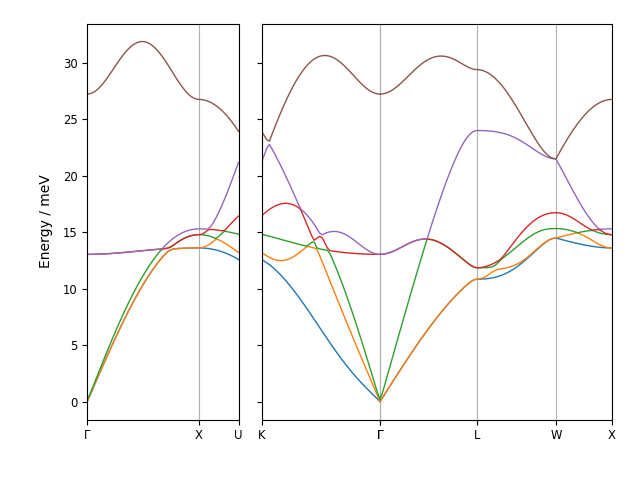
Or, to plot along a recommended q-point path from Phonopy force constants with an acoustic sum rule, run:
euphonic-dispersion NaCl/phonopy.yaml --asr reciprocal
To see all the command line options, run:
euphonic-dispersion -h
You can also see the available command line options below. For information on advanced plot styling, see Customising plots.
Command Line Options
Plots a band structure from the file provided. If a force constants file is provided, a band structure path is generated using Seekpath
usage: euphonic-dispersion [-h] [--asr [{reciprocal,realspace}]]
                           [--dipole-parameter DIPOLE_PARAMETER]
                           [--use-c | --disable-c] [--n-threads N_THREADS]
                           [--save-json SAVE_JSON] [-s SAVE_TO]
                           [--title TITLE] [--x-label XLABEL]
                           [--y-label YLABEL] [--style STYLE [STYLE ...]]
                           [--no-base-style] [--font FONT]
                           [--font-size FONTSIZE] [--fig-size FIGSIZE FIGSIZE]
                           [--fig-size-unit FIGSIZE_UNIT]
                           [--line-width LINEWIDTH] [--e-min E_MIN]
                           [--e-max E_MAX] [--energy-unit ENERGY_UNIT]
                           [--length-unit LENGTH_UNIT] [--q-spacing Q_SPACING]
                           [--btol BTOL] [--reorder]
                           filename
File I/O arguments
- filename
Phonon data file. This should contain force constants or phonon mode data. Force constants formats: .yaml, force_constants.hdf5 (Phonopy); .castep_bin , .check (Castep); .json (Euphonic). Phonon mode data formats: {band,qpoints,mesh}.{hdf5,yaml} (Phonopy); .phonon (Castep); .json (Euphonic)
- --save-json
Save spectrum to a .json file with this name
q-point sampling arguments
- --length-unit
Length units; these will be inverted to obtain units of distance between q-points (e.g. “bohr” for bohr^-1).
Default: “angstrom”
- --q-spacing
Target distance between q-point samples in 1/LENGTH_UNIT
Default: 0.025
- --btol
Distance threshold used for automatically splitting discontinuous segments of reciprocal space onto separate subplots. This is specified as a multiple of the median distance between q-points.
Default: 10.0
energy/frequency arguments
- --e-min
Energy range minimum in ENERGY_UNIT
- --e-max
Energy range maximum in ENERGY_UNIT
- --energy-unit, -u
Energy units
Default: “meV”
Force constants interpolation arguments
- --asr
Possible choices: reciprocal, realspace
Apply an acoustic-sum-rule (ASR) correction to the data: “realspace” applies the correction to the force constant matrix in real space. “reciprocal” applies the correction to the dynamical matrix at each q-point.
- --dipole-parameter
Set the cutoff in real/reciprocal space for the dipole Ewald sum; higher values use more reciprocal terms. If tuned correctly this can result in performance improvements. See euphonic-optimise-dipole-parameter program for help on choosing a good DIPOLE_PARAMETER.
Default: 1.0
Plotting arguments
- -s, --save-to
Save resulting plot to a file with this name
- --title
Plot title
Default: “”
- --x-label, --xlabel
Plot x-axis label
- --y-label, --ylabel
Plot y-axis label
- --style
Matplotlib styles (name or file)
- --no-base-style
Remove all default formatting before applying other style options.
Default: False
- --font
Select text font. (This has to be a name known to Matplotlib. font-family will be set to sans-serif; it doesn’t matter if)the font is actually sans-serif.
- --font-size, --fontsize
Set base font size in pt.
- --fig-size, --figsize
Figure canvas size in FIGSIZE-UNITS
- --fig-size-unit, --figsize-unit
Unit of length for –figsize
Default: “cm”
- --line-width, --linewidth
Set line width in pt.
Band arguments
Options related to plotting 1D bands (“spaghetti plots”).
- --reorder
Try to determine branch crossings from eigenvectors and rearrange frequencies accordingly
Default: False