Customising plots
Command-line options
Several of Euphonic’s Command-line Tools produce 2D plots. A few command-line arguments are provided to tweak the plot size, font settings and colour maps, e.g.:
euphonic-dos --font Monaco --fontsize 18 --figsize 10 10 --figsize-unit cm quartz.castep_bin
will produce a plot with larger (hopefully monospace) text on a small
square canvas. This may be especially useful with the --save-to
option to create consistent plots for presentation slides and academic
papers.
The --font option will be passed to the Matplotlib library as the
preferred “sans-serif” option, and the font family will be set to
sans-serif. Unfortunately it can be tricky to identify exactly which
font names are accepted by Matplotlib. We cannot advise on this for
all platforms, so if you have a preferred font it may be worth
searching for help on using this font with Matplotlib.
Using Matplotlib styles
These and other appearance customisations can be defined as a Matplotlib style sheet. A number of popular styles are predefined in Matplotlib and may be accessed by name, e.g.:
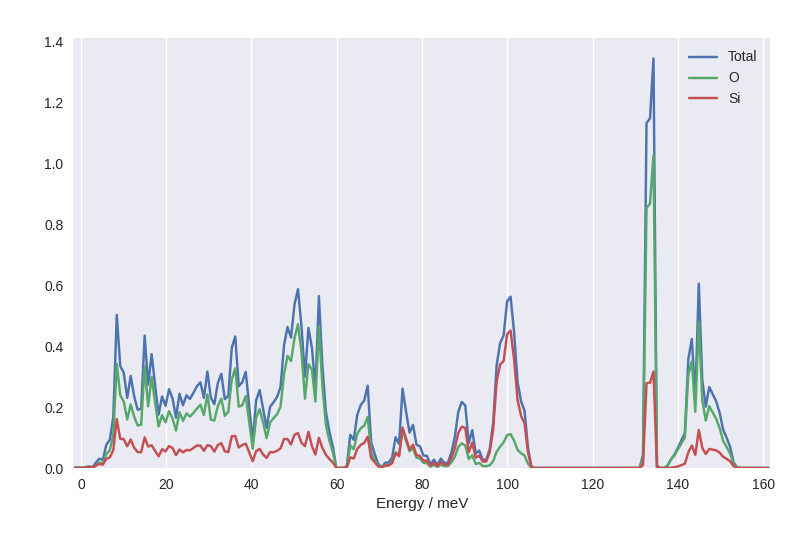
euphonic-dos --pdos --style seaborn quartz.castep_bin
will yield a plot on a grey background with white gridlines.
--style=dark_background might be preferred for some slide
presentations.
Using custom stylesheets
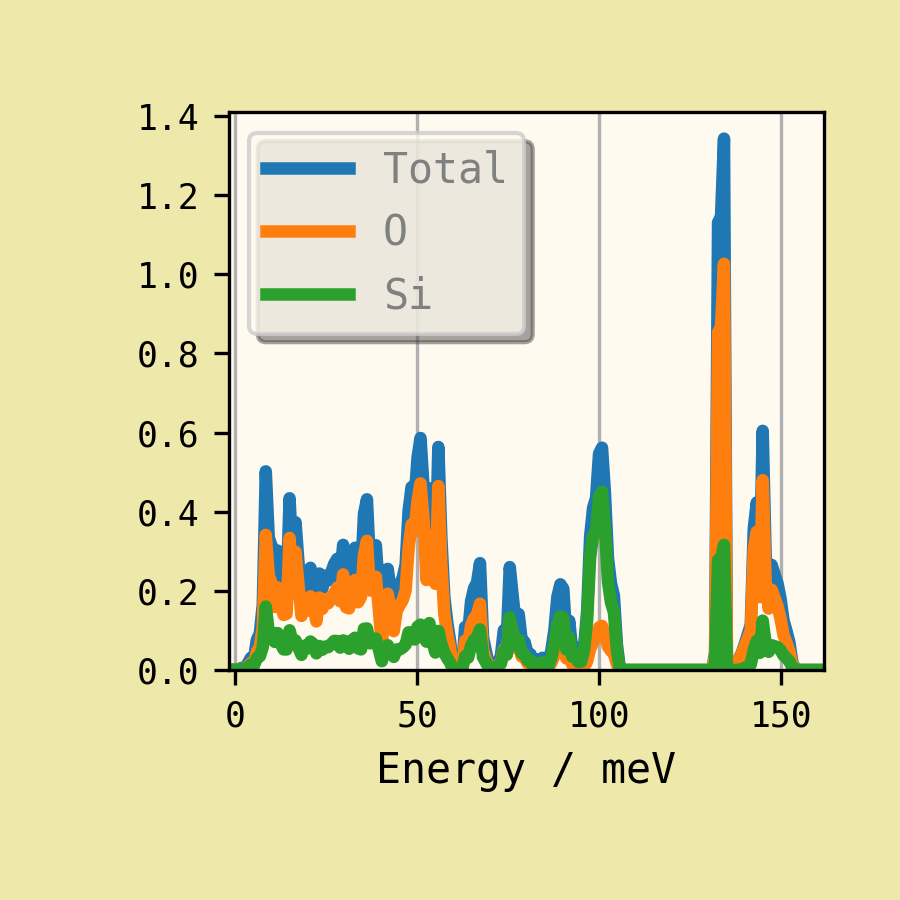
For a custom scheme, you can develop your own style file. For example, with the following file saved as “custom.mplstyle”
axes.facecolor: floralwhite
font.family: monospace
text.color: grey
lines.linewidth : 3
xtick.labelsize : smaller
legend.fancybox: True
legend.shadow: True
figure.figsize : 3, 3
figure.facecolor : palegoldenrod
then the command:
euphonic-dos quartz.castep_bin --pdos --style custom.mplstyle
generates a small figure with some “opinionated” styling.
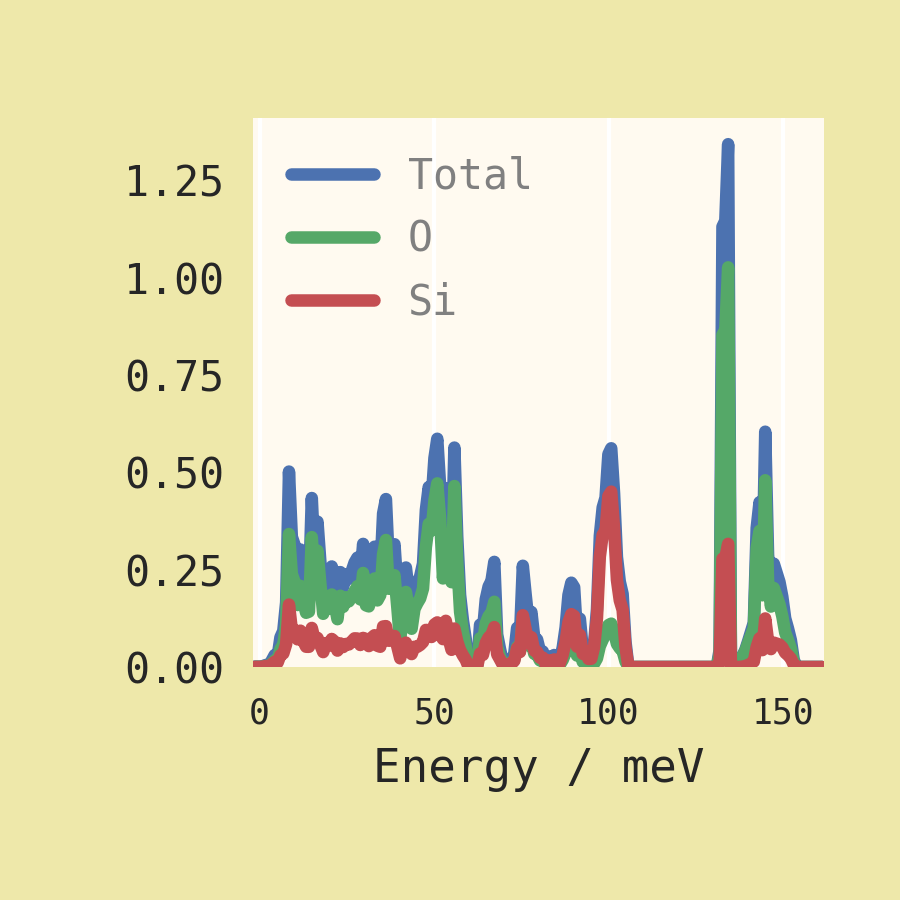
It is possible to “compose” multiple styles in ascending priority order, e.g.:
euphonic-dos quartz.castep_bin --pdos --style seaborn custom.mplstyle
In the resulting figure, the customised text and canvas options have taken priority, but we still get the Seaborn colour sequence for plot lines. The plot outline, ticks and legend box were removed. (And with them, the legend customisation!)
For a large project, this can be very useful to establish a general
“house style” with variations for certain plot types. However, as seen
above, combining styles can sometimes have unexpected consequences. In
order to prevent conflict between Euphonic’s own stylesheet and other
style options, the --no-base-style argument can be used to remove
the Euphonic defaults. For example, with the seaborn style this
will restore the horizontal grid lines that are expected to replace
the missing black ticks.