euphonic-intensity-map
The euphonic-intensity-map program can be used to plot a 2D intensity
map either along a specific trajectory from precalculated phonon frequencies
and eigenvectors, or along a recommended reciprocal space path from force
constants.
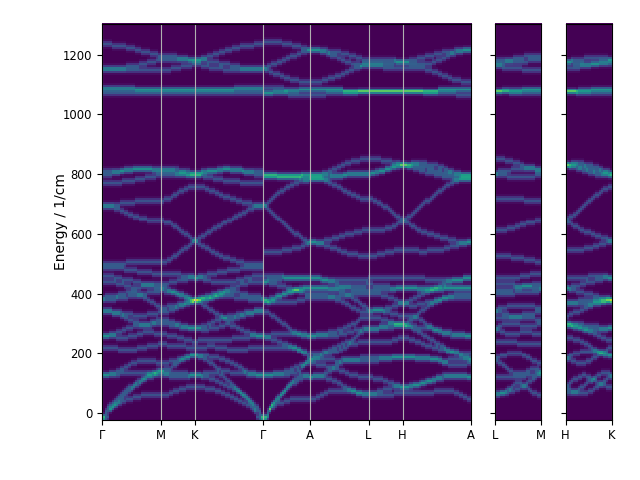
For example, to plot a DOS-weighted intensity map from CASTEP force constants along a recommended q-point path, in units of 1/cm with an energy broadening of 15 1/cm, one could run:
euphonic-intensity-map quartz.castep_bin --weighting dos --energy-unit 1/cm --energy-broadening 15
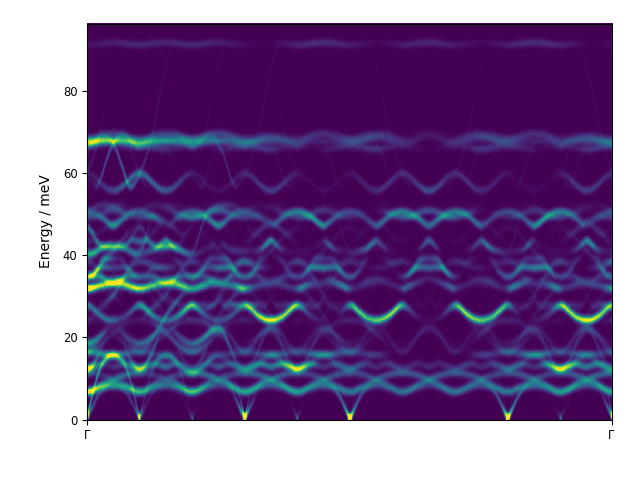
Or, to plot coherent inelastic neutron scattering intensities from CASTEP phonon frequencies, with 1000 energy bins and a broadening of 1.5 meV:
euphonic-intensity-map La2Zr2O7.phonon --weighting coherent --ebins 1000 --energy-broadening 1.5
To see all the command line options, run:
euphonic-intensity-map -h
You can also see the available command line options below. For information on advanced plot styling, see Customising plots.
Command Line Options
Plots a 2D intensity map from the file provided. If a force constants file is provided, a band structure path is generated using Seekpath
usage: euphonic-intensity-map [-h] [--asr [{reciprocal,realspace}]]
                              [--dipole-parameter DIPOLE_PARAMETER]
                              [--use-c | --disable-c] [--n-threads N_THREADS]
                              [--weighting {dos,coherent}]
                              [--temperature TEMPERATURE]
                              [--grid GRID GRID GRID | --grid-spacing GRID_SPACING]
                              [--scale SCALE] [--save-json SAVE_JSON]
                              [-s SAVE_TO] [--title TITLE] [--x-label XLABEL]
                              [--y-label YLABEL] [--style STYLE [STYLE ...]]
                              [--no-base-style] [--font FONT]
                              [--font-size FONTSIZE]
                              [--fig-size FIGSIZE FIGSIZE]
                              [--fig-size-unit FIGSIZE_UNIT] [--e-min E_MIN]
                              [--e-max E_MAX] [--energy-unit ENERGY_UNIT]
                              [--ebins EBINS]
                              [--energy-broadening ENERGY_BROADENING [ENERGY_BROADENING ...]]
                              [--shape [{gauss,lorentz}]]
                              [--length-unit LENGTH_UNIT]
                              [--q-spacing Q_SPACING]
                              [--q-broadening Q_BROADENING] [--v-min VMIN]
                              [--v-max VMAX] [--c-map CMAP] [--btol BTOL]
                              filename
File I/O arguments
- filename
Phonon data file. This should contain force constants or phonon mode data. Force constants formats: .yaml, force_constants.hdf5 (Phonopy); .castep_bin , .check (Castep); .json (Euphonic). Phonon mode data formats: {band,qpoints,mesh}.{hdf5,yaml} (Phonopy); .phonon (Castep); .json (Euphonic)
- --save-json
Save spectrum to a .json file with this name
q-point sampling arguments
“GRID” options relate to Monkhorst-Pack sampling for the Debye-Waller factor, and only apply when –weighting=coherent and –temperature is set. “Q” options relate to the x-axis of spectrum data.
- --grid
Defines a Monkhorst-Pack grid.
- --grid-spacing
q-point spacing of Monkhorst-Pack grid.
Default: 0.1
- --length-unit
Length units; these will be inverted to obtain units of distance between q-points (e.g. “bohr” for bohr^-1).
Default: “angstrom”
- --q-spacing
Target distance between q-point samples in 1/LENGTH_UNIT
Default: 0.025
- --q-broadening, --qb
FWHM of broadening on q axis in 1/LENGTH_UNIT (no broadening if unspecified).
- --btol
Distance threshold used for automatically splitting discontinuous segments of reciprocal space onto separate subplots. This is specified as a multiple of the median distance between q-points.
Default: 10.0
energy/frequency arguments
- --e-min
Energy range minimum in ENERGY_UNIT
- --e-max
Energy range maximum in ENERGY_UNIT
- --energy-unit, -u
Energy units
Default: “meV”
- --ebins
Number of energy bins
Default: 200
- --energy-broadening, --eb
The FWHM of broadening on energy axis in ENERGY_UNIT (no broadening if unspecified). If multiple values are provided, these will be interpreted as polynomial coefficients to be evaluated in ENERGY_UNIT base, e.g. –energy-broadening 1. 0.01 1e-6 –energy-unit meV will apply FWHM of (1. + 0.01 (energy / meV) + 1e-6 (energy / meV)^2) meV.
- --shape
Possible choices: gauss, lorentz
The broadening shape
Default: “gauss”
Force constants interpolation arguments
- --asr
Possible choices: reciprocal, realspace
Apply an acoustic-sum-rule (ASR) correction to the data: “realspace” applies the correction to the force constant matrix in real space. “reciprocal” applies the correction to the dynamical matrix at each q-point.
- --dipole-parameter
Set the cutoff in real/reciprocal space for the dipole Ewald sum; higher values use more reciprocal terms. If tuned correctly this can result in performance improvements. See euphonic-optimise-dipole-parameter program for help on choosing a good DIPOLE_PARAMETER.
Default: 1.0
Property-calculation arguments
- --weighting, -w
Possible choices: dos, coherent
Spectral weighting to plot: DOS, coherent inelastic neutron scattering
Default: “dos”
- --temperature
Temperature in K; enable Debye-Waller factor calculation. (Only applicable when –weighting=coherent).
- --scale
Intensity scale factor
Plotting arguments
- -s, --save-to
Save resulting plot to a file with this name
- --title
Plot title
Default: “”
- --x-label, --xlabel
Plot x-axis label
- --y-label, --ylabel
Plot y-axis label
- --style
Matplotlib styles (name or file)
- --no-base-style
Remove all default formatting before applying other style options.
Default: False
- --font
Select text font. (This has to be a name known to Matplotlib. font-family will be set to sans-serif; it doesn’t matter if)the font is actually sans-serif.
- --font-size, --fontsize
Set base font size in pt.
- --fig-size, --figsize
Figure canvas size in FIGSIZE-UNITS
- --fig-size-unit, --figsize-unit
Unit of length for –figsize
Default: “cm”
- --v-min, --vmin
Minimum of data range for colormap.
- --v-max, --vmax
Maximum of data range for colormap.
- --c-map, --cmap
Matplotlib colormap